Crazy Simple Anomaly Detection for Customer Success
How to detect changes in usage, react in time and make your customers happy
The topic of anomaly detection is fascinating. There is a vast number of methods that can be used, from simple statistics to more complex unsupervised learning methods. Additionally, the impact of anomaly detection is huge. The ability to detect when things are not going as planned is a fantastic tool and one that has the potential to save lives (for example in preventive maintenance).
In this article, we will explore an extremely easy approach to anomaly detection. Sometimes the simplest solutions can have the greatest impact. In this case, we’ll use the median absolute deviation or MAD to detect possible outliers in the number of WhatsApp messages transacted by businesses.
Introduction
In the area of Customer Success, and in particular, in SaaS B2B companies, measuring our customers' product usage is paramount. In essence, SaaS businesses want to understand how their customers are using their product and how much they are using it. The reason behind it is that if customers are not using your product, it’s very likely they are having some kind of trouble. It could be that they just don’t understand how to use it, they are not getting value out of it or they are experiencing some sort of product bug. In any case, a drop in usage can result in customer churn. Among other things, the role of the Customer Success team is to identify cases where this could be happening and help those clients to ultimately lead them towards success.
Besides regular checks using, for example, MBRs or QBRs (monthly or quarterly business reviews), the Customer Success team can assume a proactive attitude by understanding when customers are using their product less than usual. This is a perfect example of implementing anomaly detection. The idea is to detect anomalies in the usage data from every customer and have the Customer Success team reach out to those customers that are dropping their usage.
Data
The kind of data to be used is very specific to the business. If you are an e-commerce platform like Shopify, you might be interested in tracking sales, if you are an email marketing platform like MailChimp, you will be interested in emails sent. As I work in Sirena, an app that lets businesses communicate with their customers through WhatsApp, I will use data on WhatsApp messages usage. For this article, I will use randomly generated data of WhatsApp messages coming from a very simple simulation. This dataset is publicly available in my Github: FakeData/WhatsAppMessages
The dataset contains the number of messages transacted by 4 different customers through a period of 10 weeks. To keep things simple, we will focus on only one customer; Customer 3.

Anomaly Detection
MAD
The median absolute deviation or MAD, is a very simple measure of variation in a sample. In that sense, it is quite similar to the standard deviation in terms of measuring statistical dispersion. The MAD is defined as being the median of the absolute value of the residuals between each observation and the median:

However, a great advantage of the MAD in comparison to the standard deviation is its robustness or insensitivity to outliers. Both the mean and the standard deviation are highly influenced by outliers and therefore are extremely bad for anomaly detection. In their paper, Leys et al. (2013) show that many researchers are still using standard deviation for representing dispersion and suggest a change towards MAD instead. They even show how to calculate it using SPSS and R. In this post, I will show you how to use it in Python to detect anomalies or outliers.
Implementation
We’ll start with looking at a single customer, Customer 3 in this case:
You’ll probably be quite surprised by how easy the implementation of this is. In fact, calculating the MAD is basically just one line of python:
What that line is doing is defining a (lambda) function that takes a numpy array (x) and calculates the median for the element-wise absolute value of the difference between each x and the median of x. Which is exactly the definition of MAD. Simple.
The only (very tiny) complication we face when calculating the MAD is that we would actually like to calculate a rolling MAD. But that’s also quite straightforward using numpy:
As you can see, first we calculate the rolling median and then we add the rolling MAD. We can plot how that looks together with the data to get a sense of what we are doing:
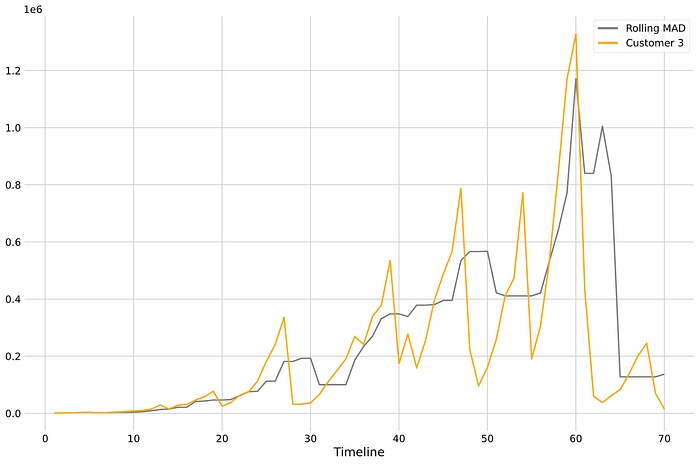
We can see that the MAD is highly lagged, and that’s OK. Remember we are not going for a hugely sophisticated anomaly detector or a predictive model. We just need to get a sense of what it would be “normal” usage changes for our clients.
Great, now that we have our MAD, we need to define criteria to understand if an observation is an actual anomaly or not. To do this we’ll add a threshold and create upper and lower bounds for our rolling MAD:
Great! Now we can add those boundaries to the graph and see what we are dealing with:
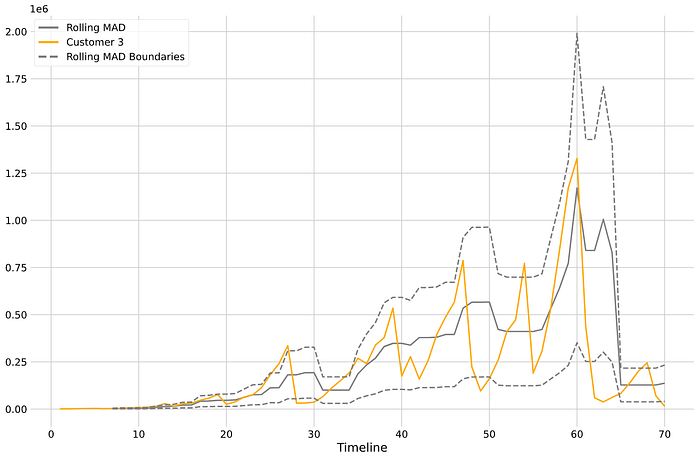
That’s looking good! Now we have our MAD and a boundary that can help us determine if an observation is an anomaly or not. This means that for every point in time if the observation is above the upper bound or below the lower bound of the rolling MAD, we’ll say that’s an anomaly.
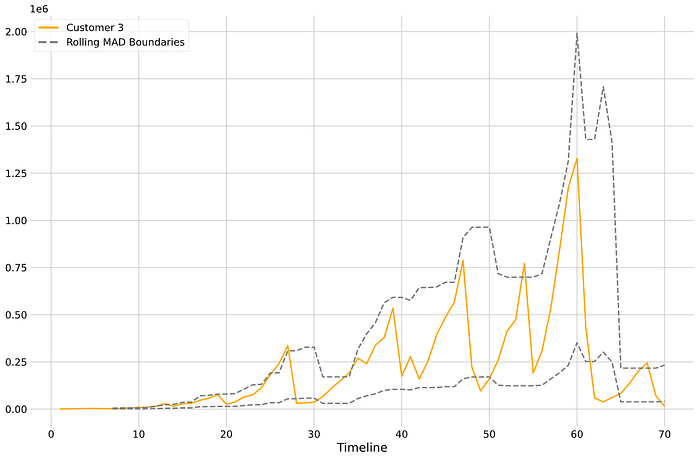
In this specific case, it looks like that 50% threshold might be a little bit too tight. We can try changing that until we are comfortable with the number of false positives. We can try with 70%.
Using this data we can very easily get a list of all the anomalies detected by our MAD implementation:
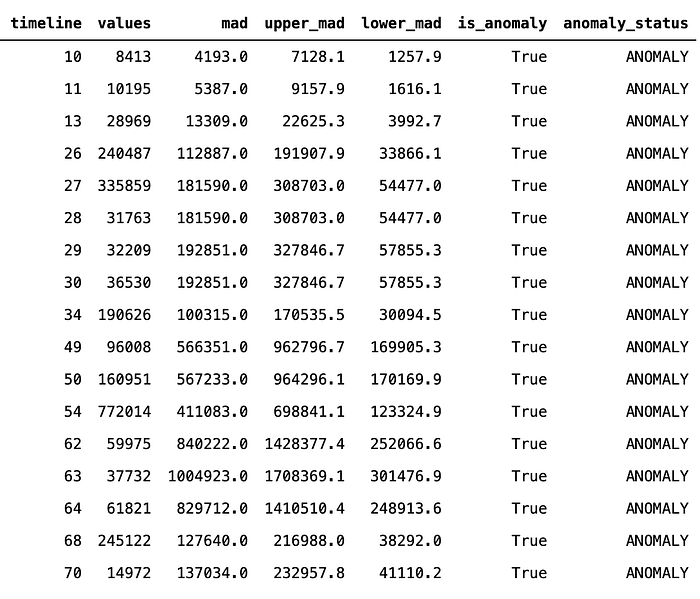
The result shows us what the usage was for each day (values), what we expected to see (MAD) and the interval (upper and lower MAD).
Conclusion
In this post, we have explored a very simple way of implementing anomaly detection for usage data using the median absolute deviation or MAD. Of course, there’s a lot of tinkering you can do to adjust this to your specific use-cases, such as the rolling window, the threshold, or the decision on when to notify your team. I’m sure you can imagine a Slack integration notifying Customer Success Executives when one of their accounts has dropped their usage. However, if your product usage has a relevant seasonality, consider adjusting the notification service. For example, in our case, it doesn’t make a lot of sense to notify CSEs if the drop in usage occurs during a weekend (usage is expected to drop during weekends). Another option is to have two MAD bounds, one for the weekend with a more permissive threshold and another one for weekdays with a more tight threshold. The possibilities are endless.
References
Leys, C., Ley, C., Klein, O., Bernard, P., & Licata, L. (2013). Detecting outliers: Do not use standard deviation around the mean, use absolute deviation around the median. Journal of experimental social psychology, 49(4), 764–766.

